25 Jun 2024
Technical Analysis: USD/JPY holds a position around the 159.50 level
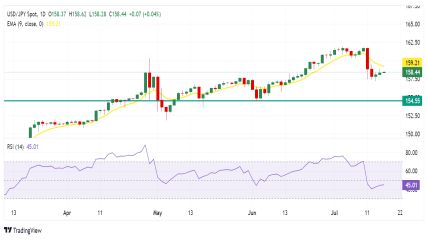
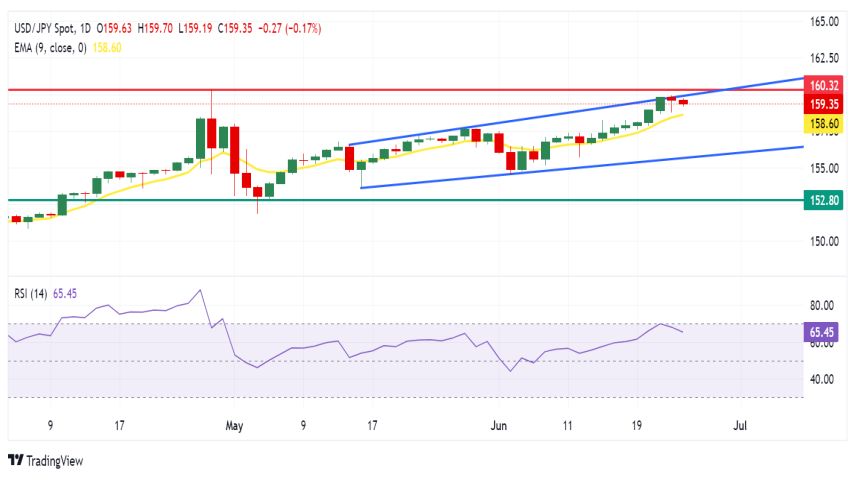
USD/JPY trades around 159.30 on Tuesday. Analyzing the daily chart shows a bullish bias, with the pair hovering near the upper boundary of an ascending channel pattern. The 14-day Relative Strength Index (RSI) is positioned above the 50 level, indicating upward momentum.
Surpassing the upper threshold of the ascending channel pattern around 159.90 will reinforce the bullish sentiment, potentially driving the USD/JPY pair toward 160.32, the highest level since April and a major resistance point.
On the downside, immediate support appears at the nine-day Exponential Moving Average (EMA) at 158.60. A breach below this level could intensify downward pressure on the USD/JPY pair, potentially driving it toward the lower boundary of the ascending channel around 155.60. A break below this level could push the pair to test the throwback support around 152.80.
JOIN WITH THE GLOBAL MARKET LEADER BROKER HERE FOR MORE PROFITABLE OPPORTUNITIES
HERE